


JANUARY 8, 2021

On Thursday, the Ministry of Statistics and Programme Implementation released the First Advance Estimates (FAE) for the current financial year.
According to MoSPI, India’s gross domestic product (GDP) — the total value of all final goods and services produced within the country in one financial year — will contract by 7.7 per cent in 2020-21.
What are the First Advance Estimates of GDP? What is their significance?
For any financial year, the MoSPI provides regular estimates of GDP. The first such instance is through the FAE. The FAE for any particular financial year is typically presented on January 7th.
Their significance lies in the fact that they are the GDP estimates that the Union Finance Ministry uses to decide the next financial year’s Budget allocations.
The FAE will be quickly updated as more information becomes available. On February 26th, MoSPI will come out with the Second Advance Estimates of GDP for the current year.
How are the FAE arrived at before the end of the concerned financial year?
The FAE are derived by extrapolating the available data. According to the MoSPI, the approach for compiling the Advance Estimates is based on Benchmark-Indicator method.
The sector-wise estimates are obtained by extrapolating indicators such as
#Index of Industrial Production (IIP) of first 7 months of the financial year
#Financial performance of listed companies in the private corporate sector available up to quarter ending September, 2020
#The 1st Advance Estimates of crop production,
#The accounts of central & state governments,
#Information on indicators like deposits & credits, passenger and freight earnings of Railways, passengers and cargo handled by civil aviation, cargo handled at major sea ports, sales of commercial vehicles, etc., available for first 8 months of the financial year.
How is the data extrapolated?
In the past, extrapolation for indicators such as the IIP was done by dividing the cumulative value for the first 7 months of the current financial year by average of the ratio of the cumulative value of the first 7 months to the annual value of past years.
So if the annual value of a variable was twice that of the value in the first 7 months in the previous years then for the current year as well the annual value is assumed to be double that of the first 7 months.
However, this year, because of the pandemic there were wide fluctuations in the monthly data. Moreover, there was a significant drop, especially in the first quarter, on many counts. That is why the usual projection techniques would not have yielded robust results.
As such, MoSPI has tweaked the ratios for most variables.
What are the key takeaways from the First Advance Estimates for 2020-21?
There are 7 key takeaways.
#1 GDP Growth Rate:
In the context of recent history, the 7.7 per cent contraction in GDP (see Table 1) is a sharp one considering that India has registered an average annual GDP growth rate of 6.8 per cent since the start of economic liberalization in 1992-93.
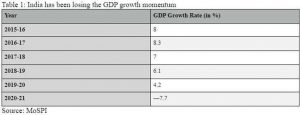
But, a big reason for the contraction this year has been the disruption caused by Covid-induced lockdowns which saw the economy contract by almost 24 per cent in the first quarter (April, May and June) and by 15.7 per cent during the first half (H1) of the year (first two quarters or from April to September). As a result, the domestic economy had entered a technical recession.
However, in the second half of the current financial year — that is, October to March — the government expects the economy will produce almost exactly the same amount of goods and services that it produced in the second half of the last financial year (2019-20).
In the H1 of 2020-21, India produced goods and services worth Rs 60 lakh crore — much lower than the Rs 71 lakh crore worth of goods produced in H1 of 2019-20.
But in H2 of 2020-21, MoSPI expects GDP to be worth Rs 74.4 lakh crore, which is roughly the same as the GDP in H2 of 2019-20 — about Rs 74.7 lakh crore.
For the full year of 2020-21 then, India’s GDP is likely to be Rs 134.4 lakh crore as against Rs 145.7 lakh crore in 2019-20.
#2 Absolute level of real GDP:
At Rs 134.4 lakh crore, India’s real GDP — that is, GDP without the influence of inflation — in 2020-21 will be lower than the 2018-19 level (see Table 2).
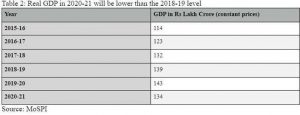
In other words, from the start of the next financial year, India would first have to raise its GDP back to the level it was at in 2019-20 (Rs 143.7 lakh crore).
#3 Per Capita GDP:
While the GDP provides an all-India aggregate, per capita GDP is a better variable if one wants to understand how an average India has been impacted.
As Table 3 shows, India’s per capita GDP will fall to Rs 99, 155 in 2020-21 — last seen four years ago during 2016-17.
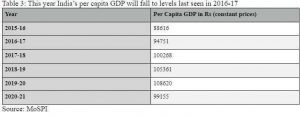
In fact, while the overall real GDP will fall by 7.7 per cent, per capita real GDP will fall by 8.7 per cent.
#4 Absolute level of real Gross Value Added (or GVA):
The Gross Value Added provides a picture of the economy from the supply side. It maps the value-added by different sectors of the economy such as agriculture, industry and services. In other words, GVA provides a proxy for the income earned by people involved in the various sectors.
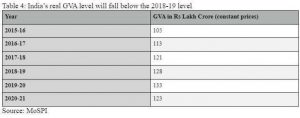
As Table 4 shows, at Rs 123.4 lakh crore, India’s real GVA level, too, will fall below the 2018-19 level.
#5 Absolute level of Private Final Consumption Expenditure (PFCE):
India’s overall GDP can be divided into four main sections.
The biggest demand for goods and services comes from private individuals trying to satisfy their consumption needs. Typically this would include all the things — be it a toothpaste or a car — that you and your family members buy in their private individual capacity. This demand is called PFCE and it constitutes over 56 per cent of the total GDP.
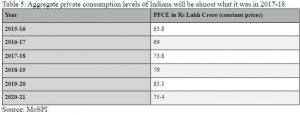
As Chart 5 shows, PFCE levels will be almost what they were in 2017-18.
#6 Per capita PFCE:
Just like per capita GDP, the per capita PFCE is also a relevant metric as it shows how much does an average Indian spend in his/her private capacity. Typically, with rising incomes standards, such consumption levels also rise.
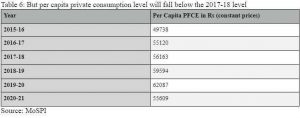
However, as Table 6 shows, at Rs 55,609, per capita PFCE will fall below the 2017-18 level.
#7 Absolute level of Gross Fixed Capital Formation (GFCF):
The second biggest component of GDP is called GFCF and it measures all the expenditures on goods and services that businesses and firms make as they invest in their productive capacity. So if your firm buys computers and software to increase the overall productivity then it will be counted under GFCF.
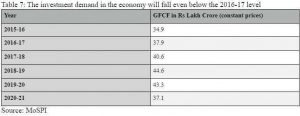
This type of demand accounts for close to 28 per cent of India’s GDP. Taken together, private demand and business demand account for almost 85 per cent of all GDP.
As Table 7 shows, at Rs 37 lakh crore, GFCF (or the investment demand in the economy) has fallen even below 2016-17 level.
Courtesy/Source: Indian Express


